 At the Circular Textiles Workshop in Sydney, Jane Milburn presented on the waste consequences of fast fashion.
Watching the Rana Plaza factory collapse in Bangladesh unfolding on television in April 2013 opened my eyes to fast fashion, industrial supply chains and modern-day slavery. I’m a member of Fashion Revolution – a global movement in 80 countries working to increase transparency along the clothing supply chain. And I’ve set up Textile Beat as a vehicle to talk about slow clothing.
Journalist Lucy Siegle says 80 billion new garments are produced globally every year and fashion is the second-most polluting industry after oil. Clothing is so cheap it is almost disposable, discarded after only a few wears.
The United Nations reports at least 1/3 of food produced is never eaten – it is likely a similar amount of clothing is wasted too. There are ethical issues – impacting on people, places and the planet.
Slide 1 Global Apparel Fibre Consumption
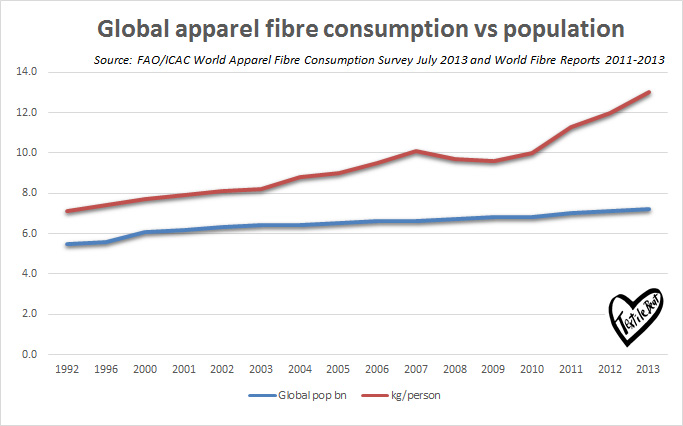 This graph is based on Food and Agriculture Organisation data. The blue line is increase in population across past two decades. The red line is average individual consumption of apparel fibre (dip is the GFC). Average consumption has nearly doubled – from 7kg to 13kg per person – in 20 years. Of course that is total apparel fibre – often at least 15% of fabric is left on the cutting room floor and becomes part of the waste associated with clothing.
Slide 2 shows change in fibres (from same data)
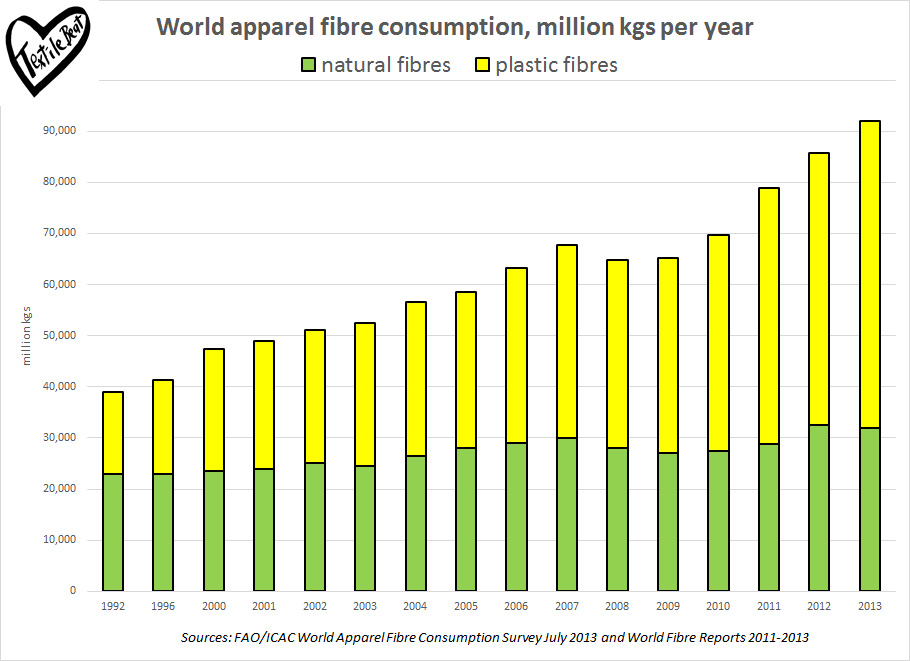 Green bars are natural fibres (mainly cotton). Yellow bars are synthetics (polyester, nylon, acryclic) derived from petroleum. In 2003, half synthetic and half natural. In 2013, two-thirds synthetic fibres. Research by ecologist Dr Mark Browne shows synthetics shed microplastic particles with every wash and that’s entering the food chain. Synthetics are slow to breakdown in landfill, and may never do so in that anaerobic environment.
These two graphs are global averages. For more specifics, there is a Textile World graph.
Slide 3 – Consumer demand for textiles by country – kg per person
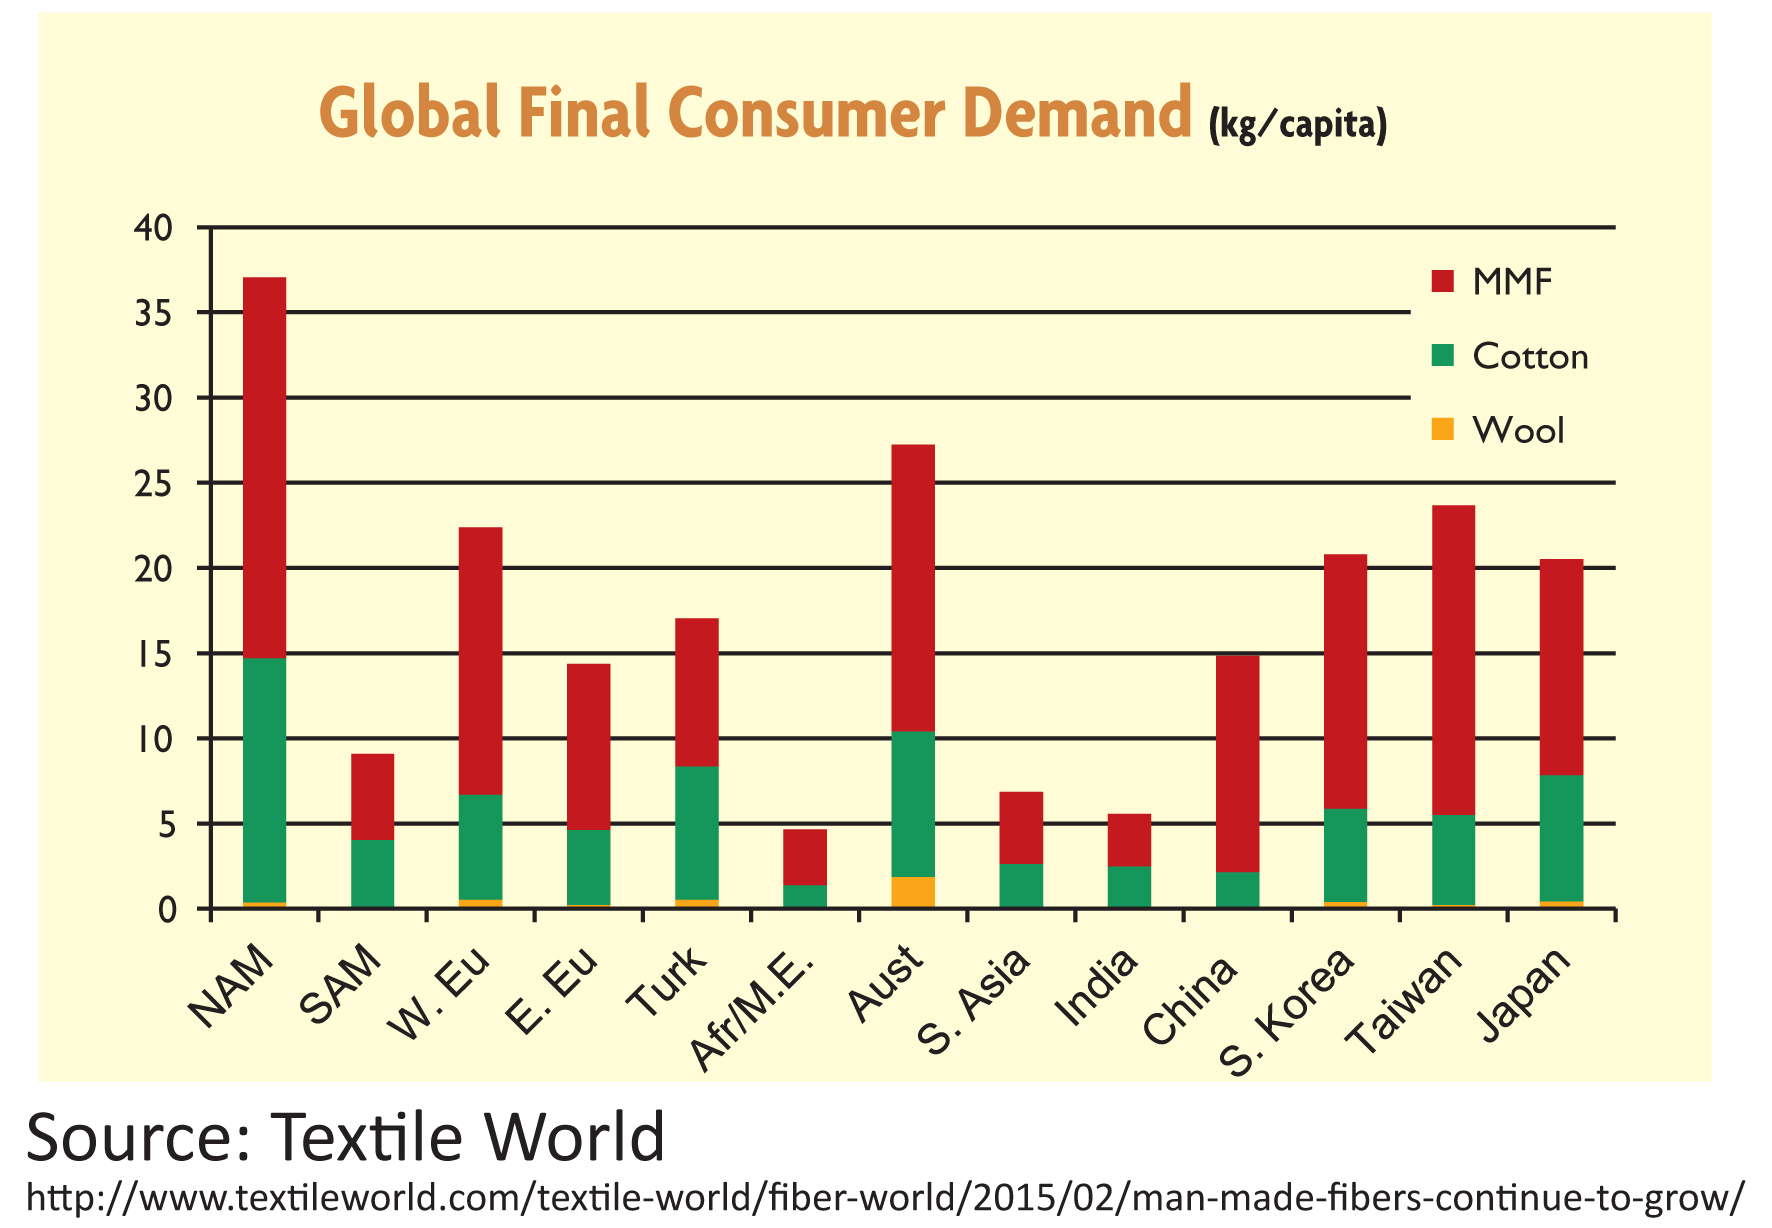
North Americans – biggest users at 37kg each, Australia is next at 27kgs, Western Europe which includes UK is 22kgs … and the developing nations such as Africa, India and southern Asia only 5kgs each. This graph affirms that 2/3rds of new clothing is synthetic fibres. So what happens after we buy all these clothes?
Slide 4 – Waste and pollution
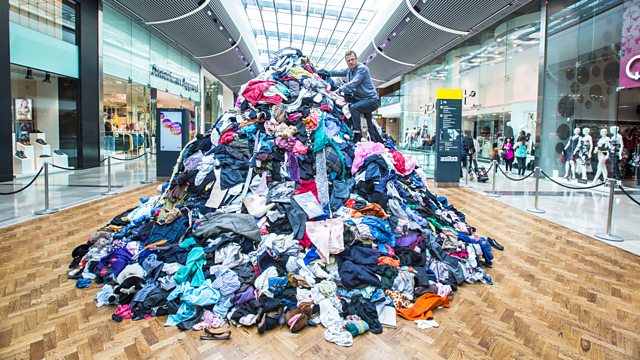 Australia has a culture of donating material goods to charity – that’s a great thing. But anecdotally, only about 15% of donated clothing is sold again locally in charity shops – about 15% becomes industrial rags, 15% and 25% goes directly to landfill, and the other 40-50% into the global second-hand trade. NACRO reports that 70 million kilograms (3kgs each) of second-hand clothing was exported from Australia in 2012 – sent to UAE, Pakistan and Malaysia. (NACRO 2013 National Waste Report pg 7). It is sold for $1 a kilogram – it is good in some ways and bad in others because it swamps local textile industries and needs to be buried or burned in those countries (Clothing Poverty – Dr Andrew Brookes). Are we exporting our waste? Not all of it. The Image above is Hugh Fearnley Whittingstall (of River Cottage fame) in documentary Hugh’s War on Waste standing on top of pile of 7 tonnes of clothes – 10,000 separate garments in Britain. He asks how long it takes for them to be discarded – a week, a day, a few hours — it is every 10 minutes …. throwing away resources, water, energy and labour.
Some fashion businesses are innovating – H&M has a takeback scheme is an upcycled collation; MUD Jeans is leasing jeans and recycling the denim; Viktor and Rolf created a stunning 2016 upcycled collection and there a lot of small businesses producing upcycled clothing.
Slide 5 – The opportunity
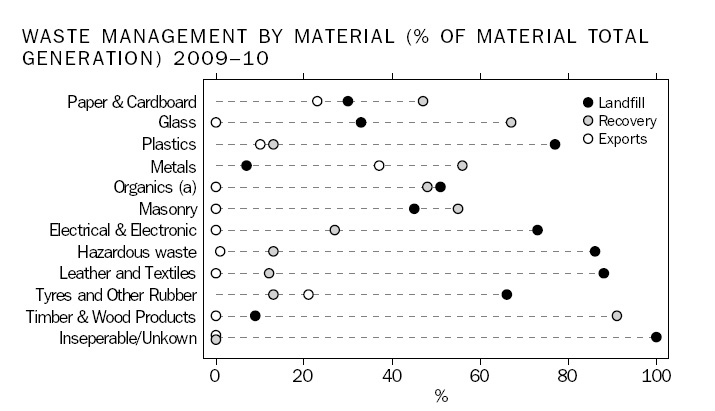 This Australia Bureau of Statistics estimates that half a million tonnes of leather and textiles were sent to landfill in 2010. If you do the maths on that, it is about 23 kilograms* per person, going to landfill. It is unspecified, but possible that figure includes carpets and blankets. We need more information on that. This ABS graph suggests only 12% to 15% is being recovered – which presents the opportunity for textile recovery.
*Australian Bureau of Statistics reports 501,000 tonnes of leather and textiles sent to landfill in 2009-10. The Australian population was 22 million in 2010, which averages out to 22.7kg per person. This figure may include carpets but that is not specified by the ABS.